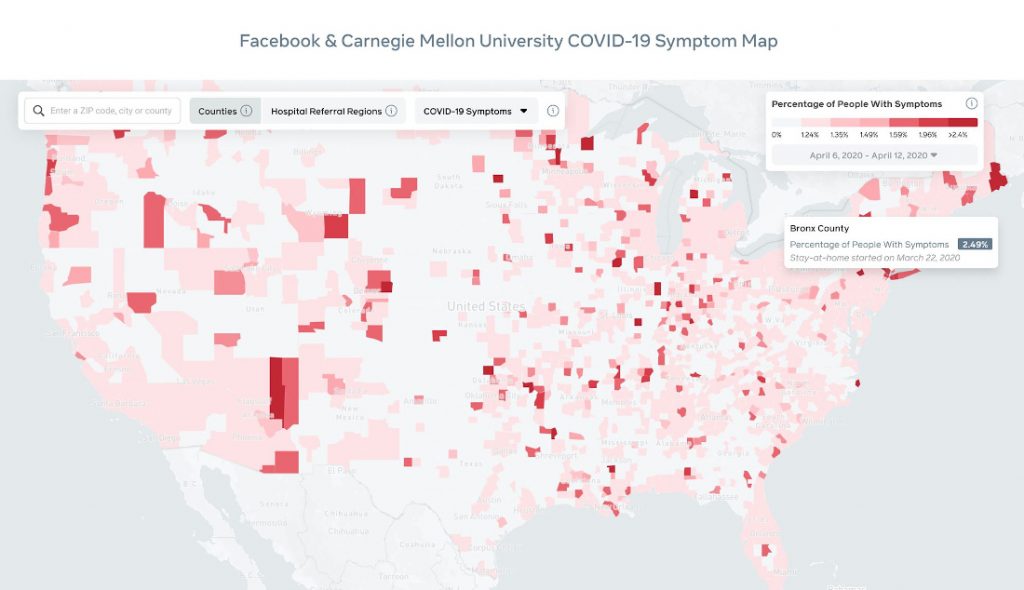
It seems like every major company that has access to large amounts of public data is releasing COVID-19 related maps to track the spread of the virus. The latest to join the fray is Facebook as they partnered with researchers at Carnegie Mellon University to release a symptom map of counties in the USA.
Unlike Apple and Google who released COVID-19 mobility reports based on its user movement data collected from their respective Maps applications, Facebook is aggregating symptom data from opt-in surveys that are conducted in partnership with the researchers at Carnegie Mellon University. They believe that they are suited for creating such a tool as they have a user base of over 2.5 billion.
They have stated that the data collection will be conducted in a private manner where only the researchers will have access to individual data and Facebook will only receive aggregated data to update its maps. The symptom map is currently only available in a county-by-county basis for the USA, but Facebook plans to expand this tool to all the countries where it operates.
Regarding the accuracy of such a tool, it’s difficult to decide. On the one hand, having more information is great for public officials, but collecting data through opt-in surveys poses many problems. Problems like users falsely reporting symptoms or users not reporting their symptoms at all. People could create multiple accounts and easily generate more incorrect data and it is unclear as to what Facebook is doing to prevent this. Along with this, there are also concerns about Facebook collecting this data in the first place, considering its track record with its data collection practices.
To check out Facebook USA COVID-19 symptom map, click here.